CapTableIQ
Understand Your Equity Before It's Too Late
Model real-world exit scenarios, liquidation preferences, and dilution to see exactly who gets paid what—and why. Built for founders, employees, and advisors who need clarity on their equity stake.
100%
Free
Instant
Interactive Scenario Modeling
409A
Valuation Analysis Included
Downloads
v1.1.1
Get the latest release
Why choose this
Why CapTableIQ
0
Demystify Complex Cap Tables
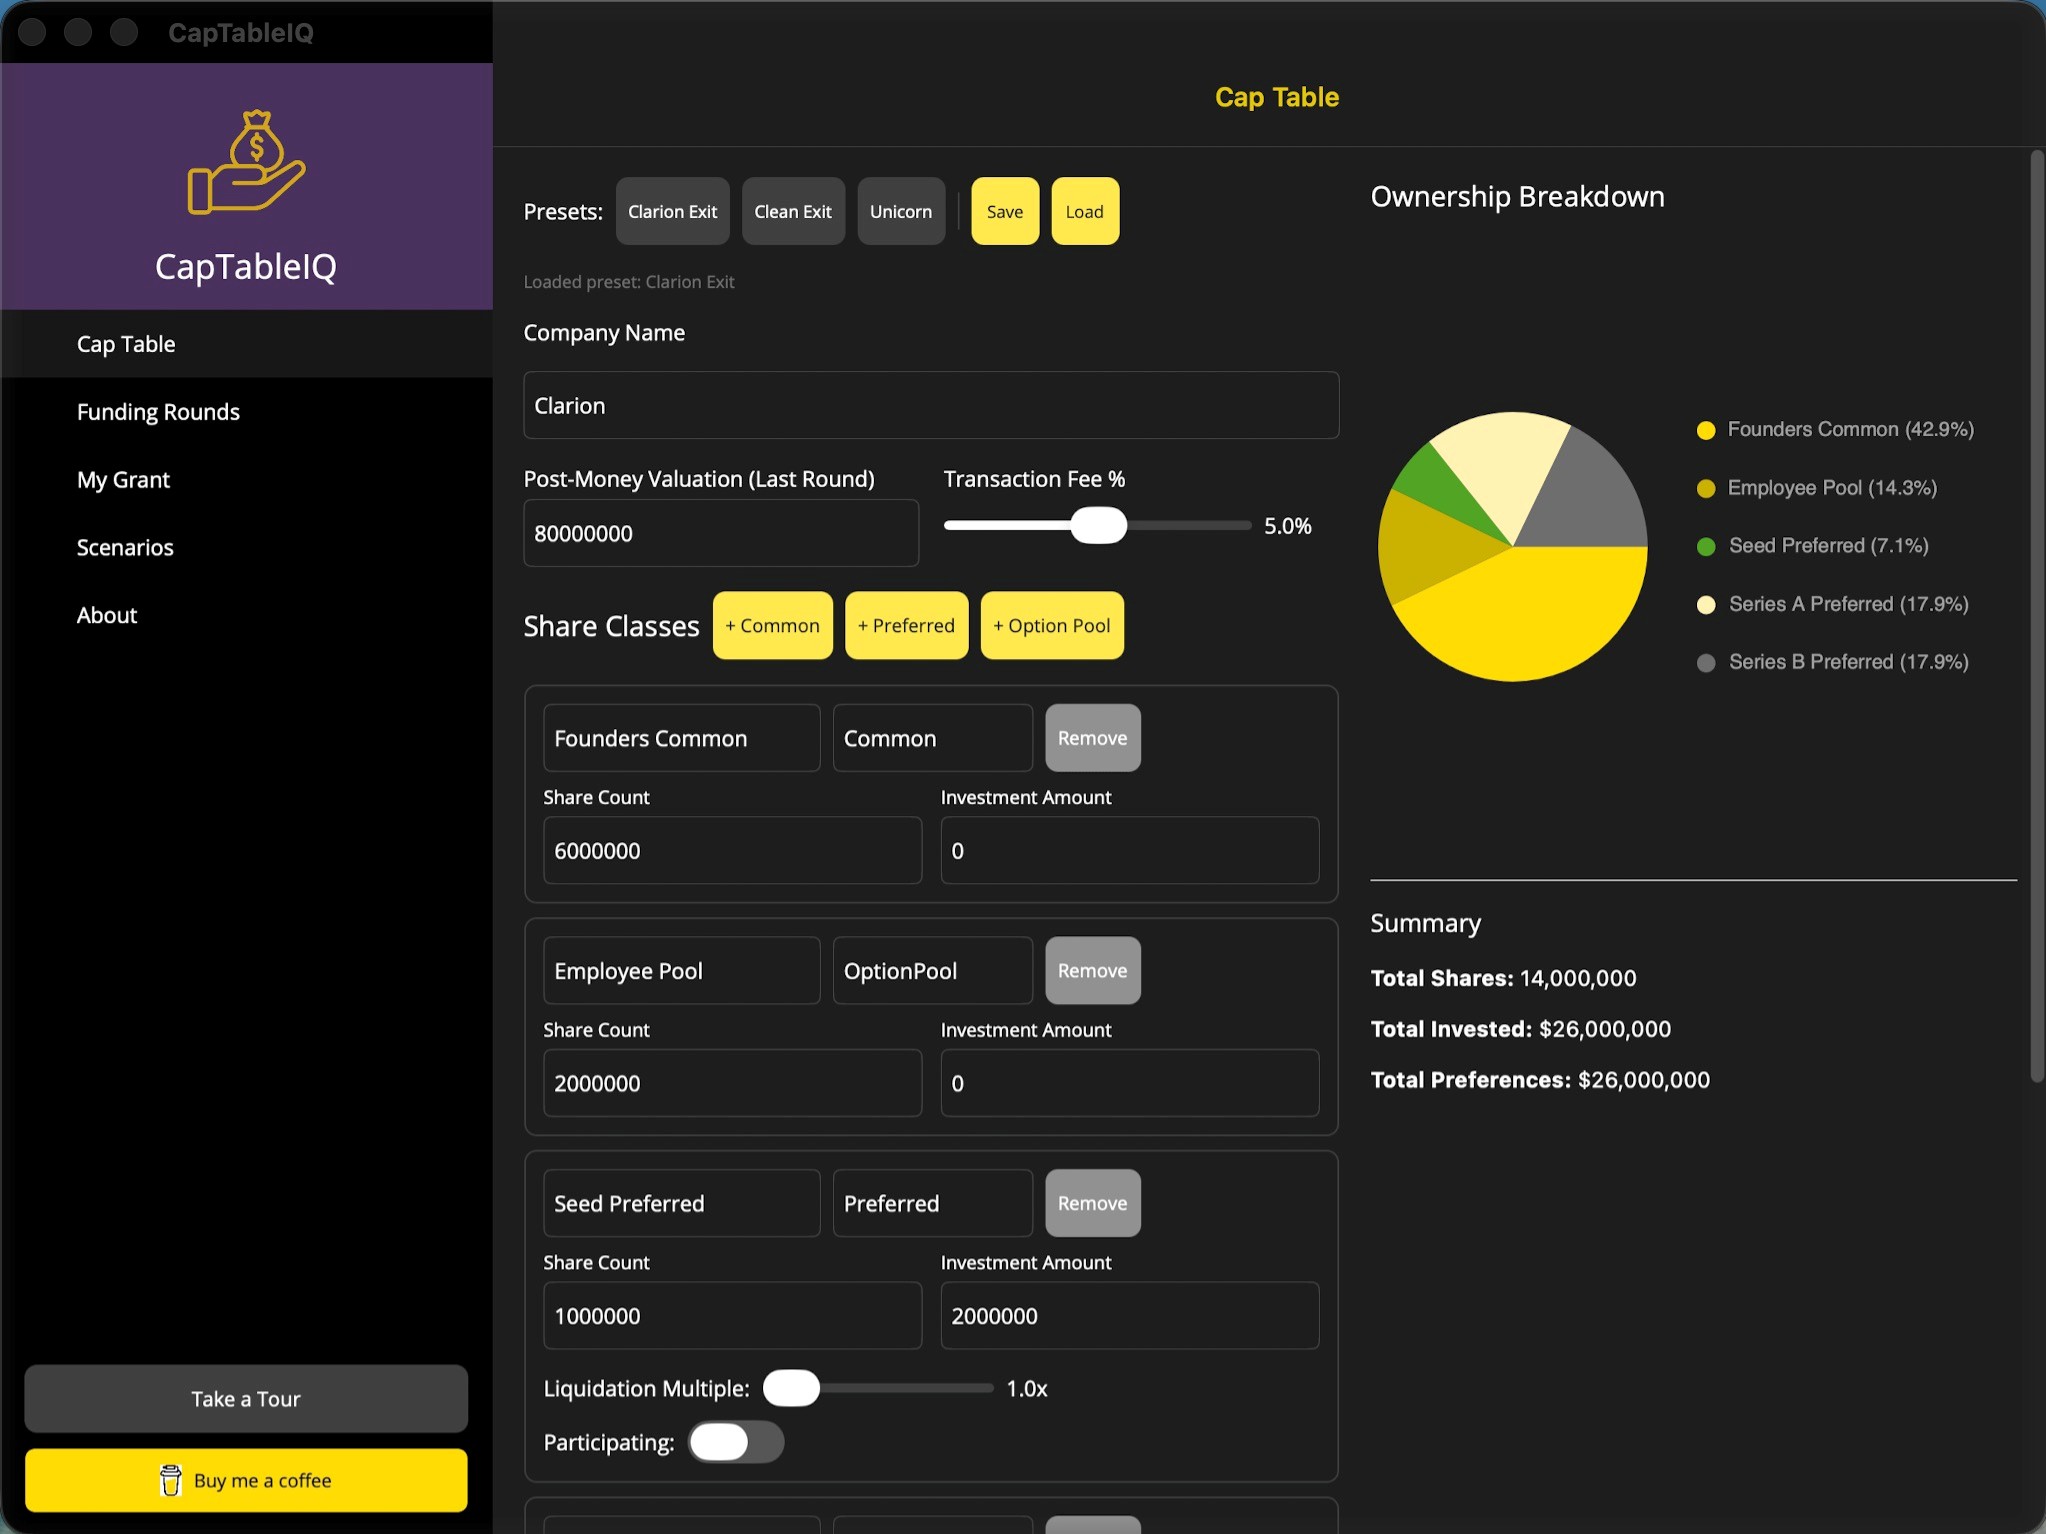
Understand liquidation preferences, participation rights, and seniority stacks with plain-language explanations and visual breakdowns. No finance degree required.
1
Model Exit Scenarios Instantly
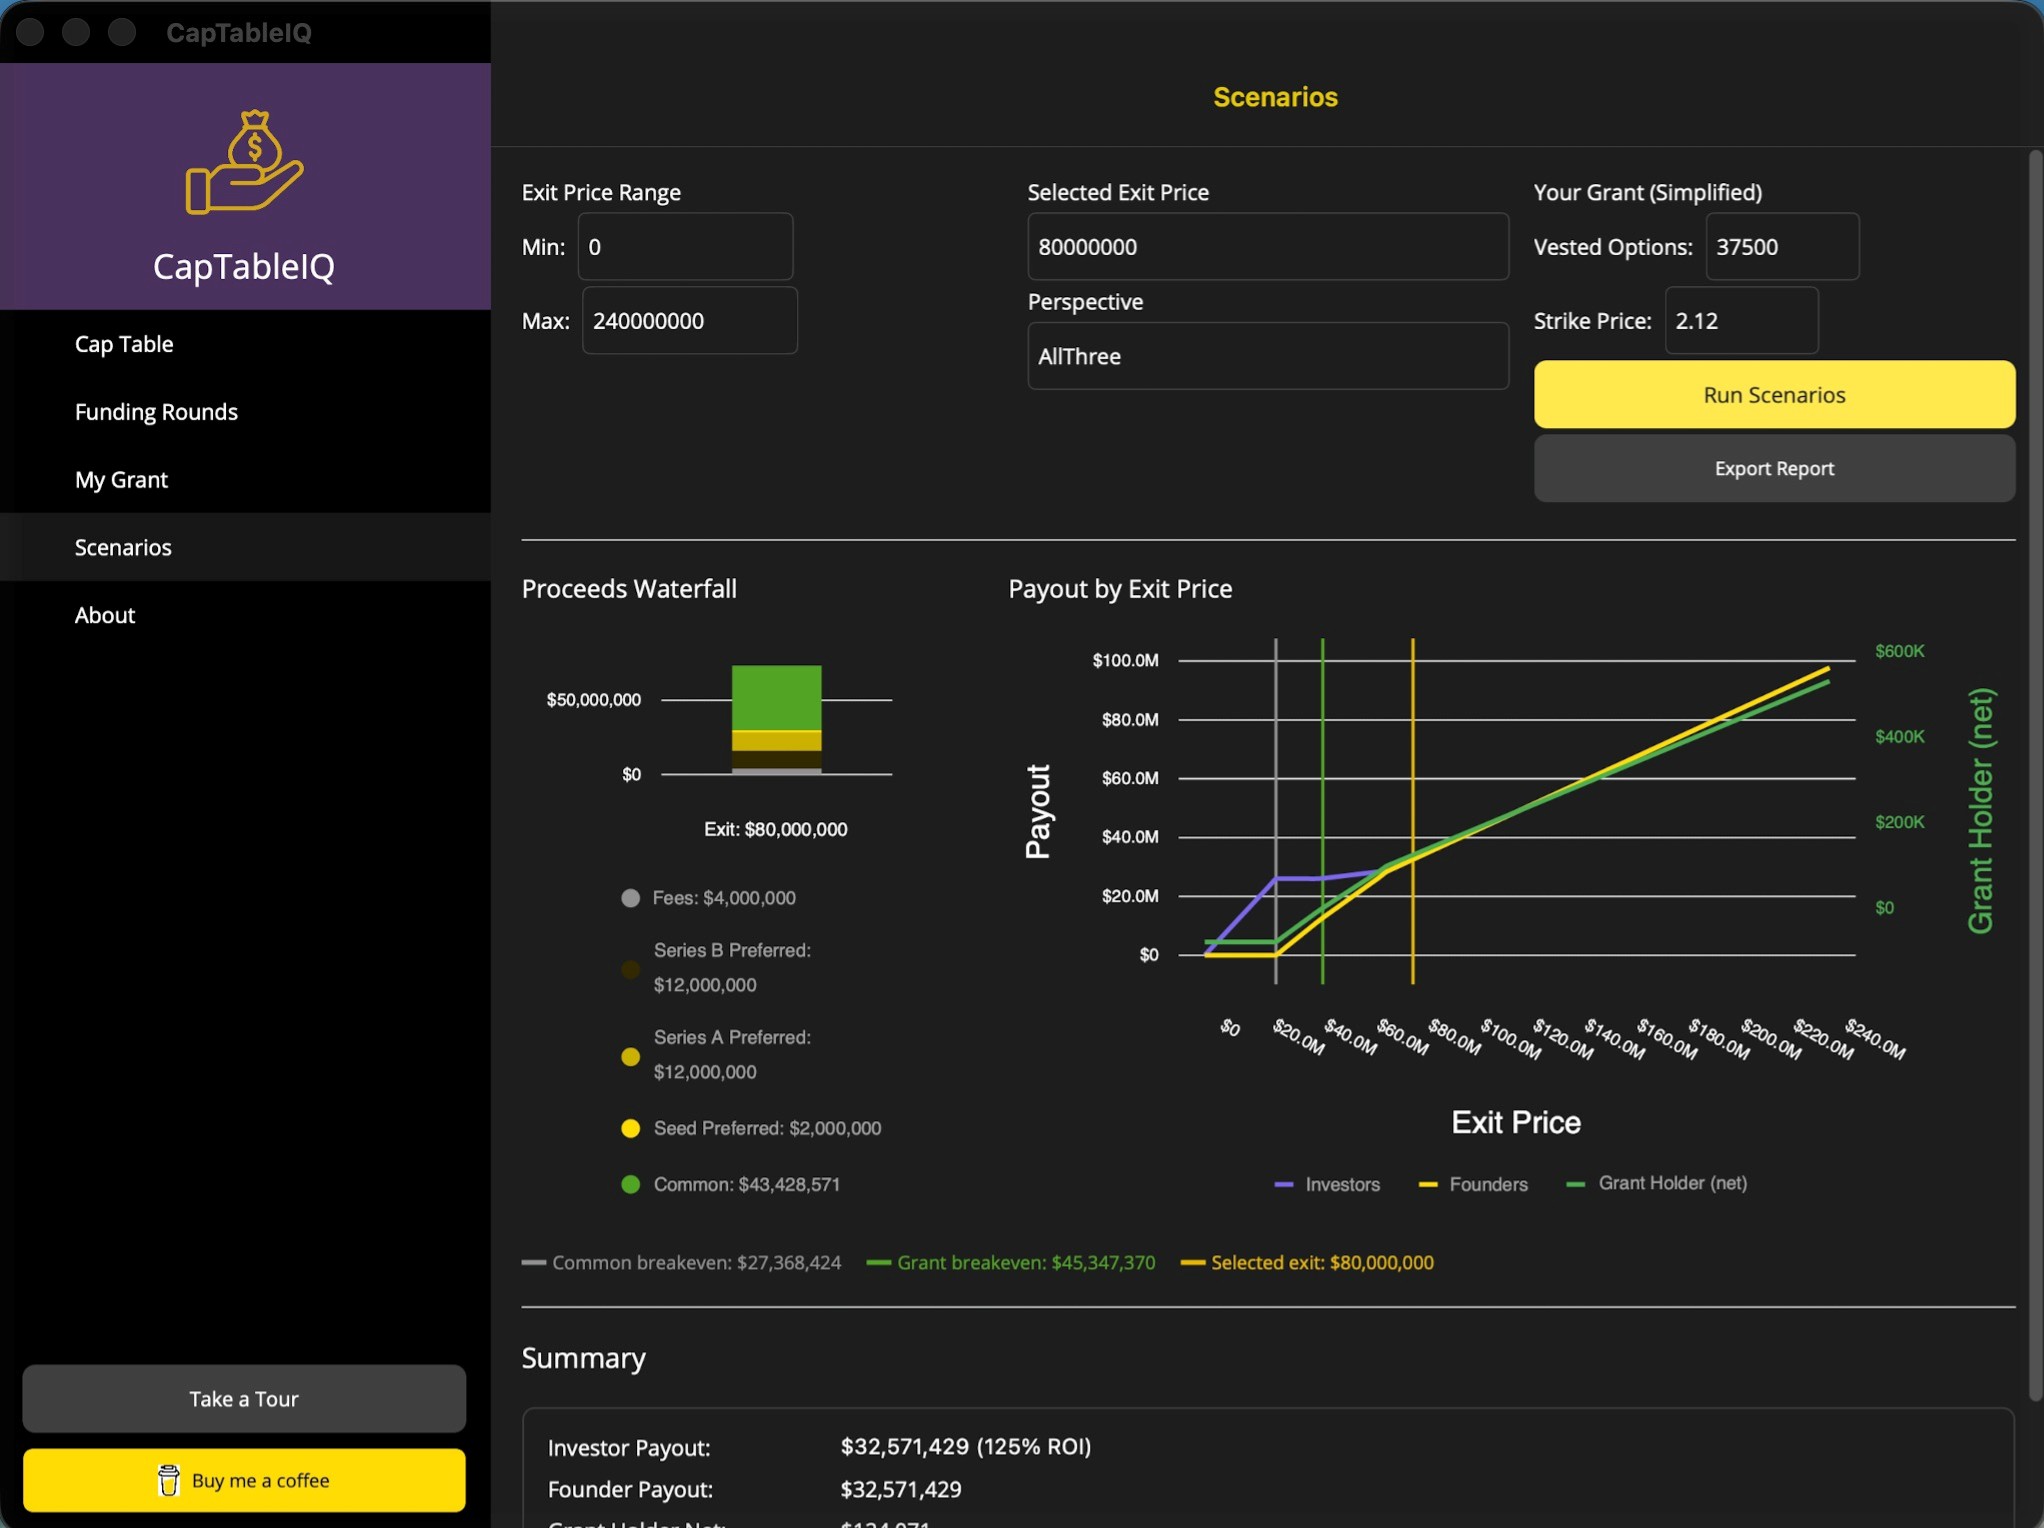
Run 50-100 exit scenarios in seconds. See exactly when investors hit 3x, when common shareholders break even, and what your equity is actually worth at different exit prices.
2
Track Dilution Across Rounds
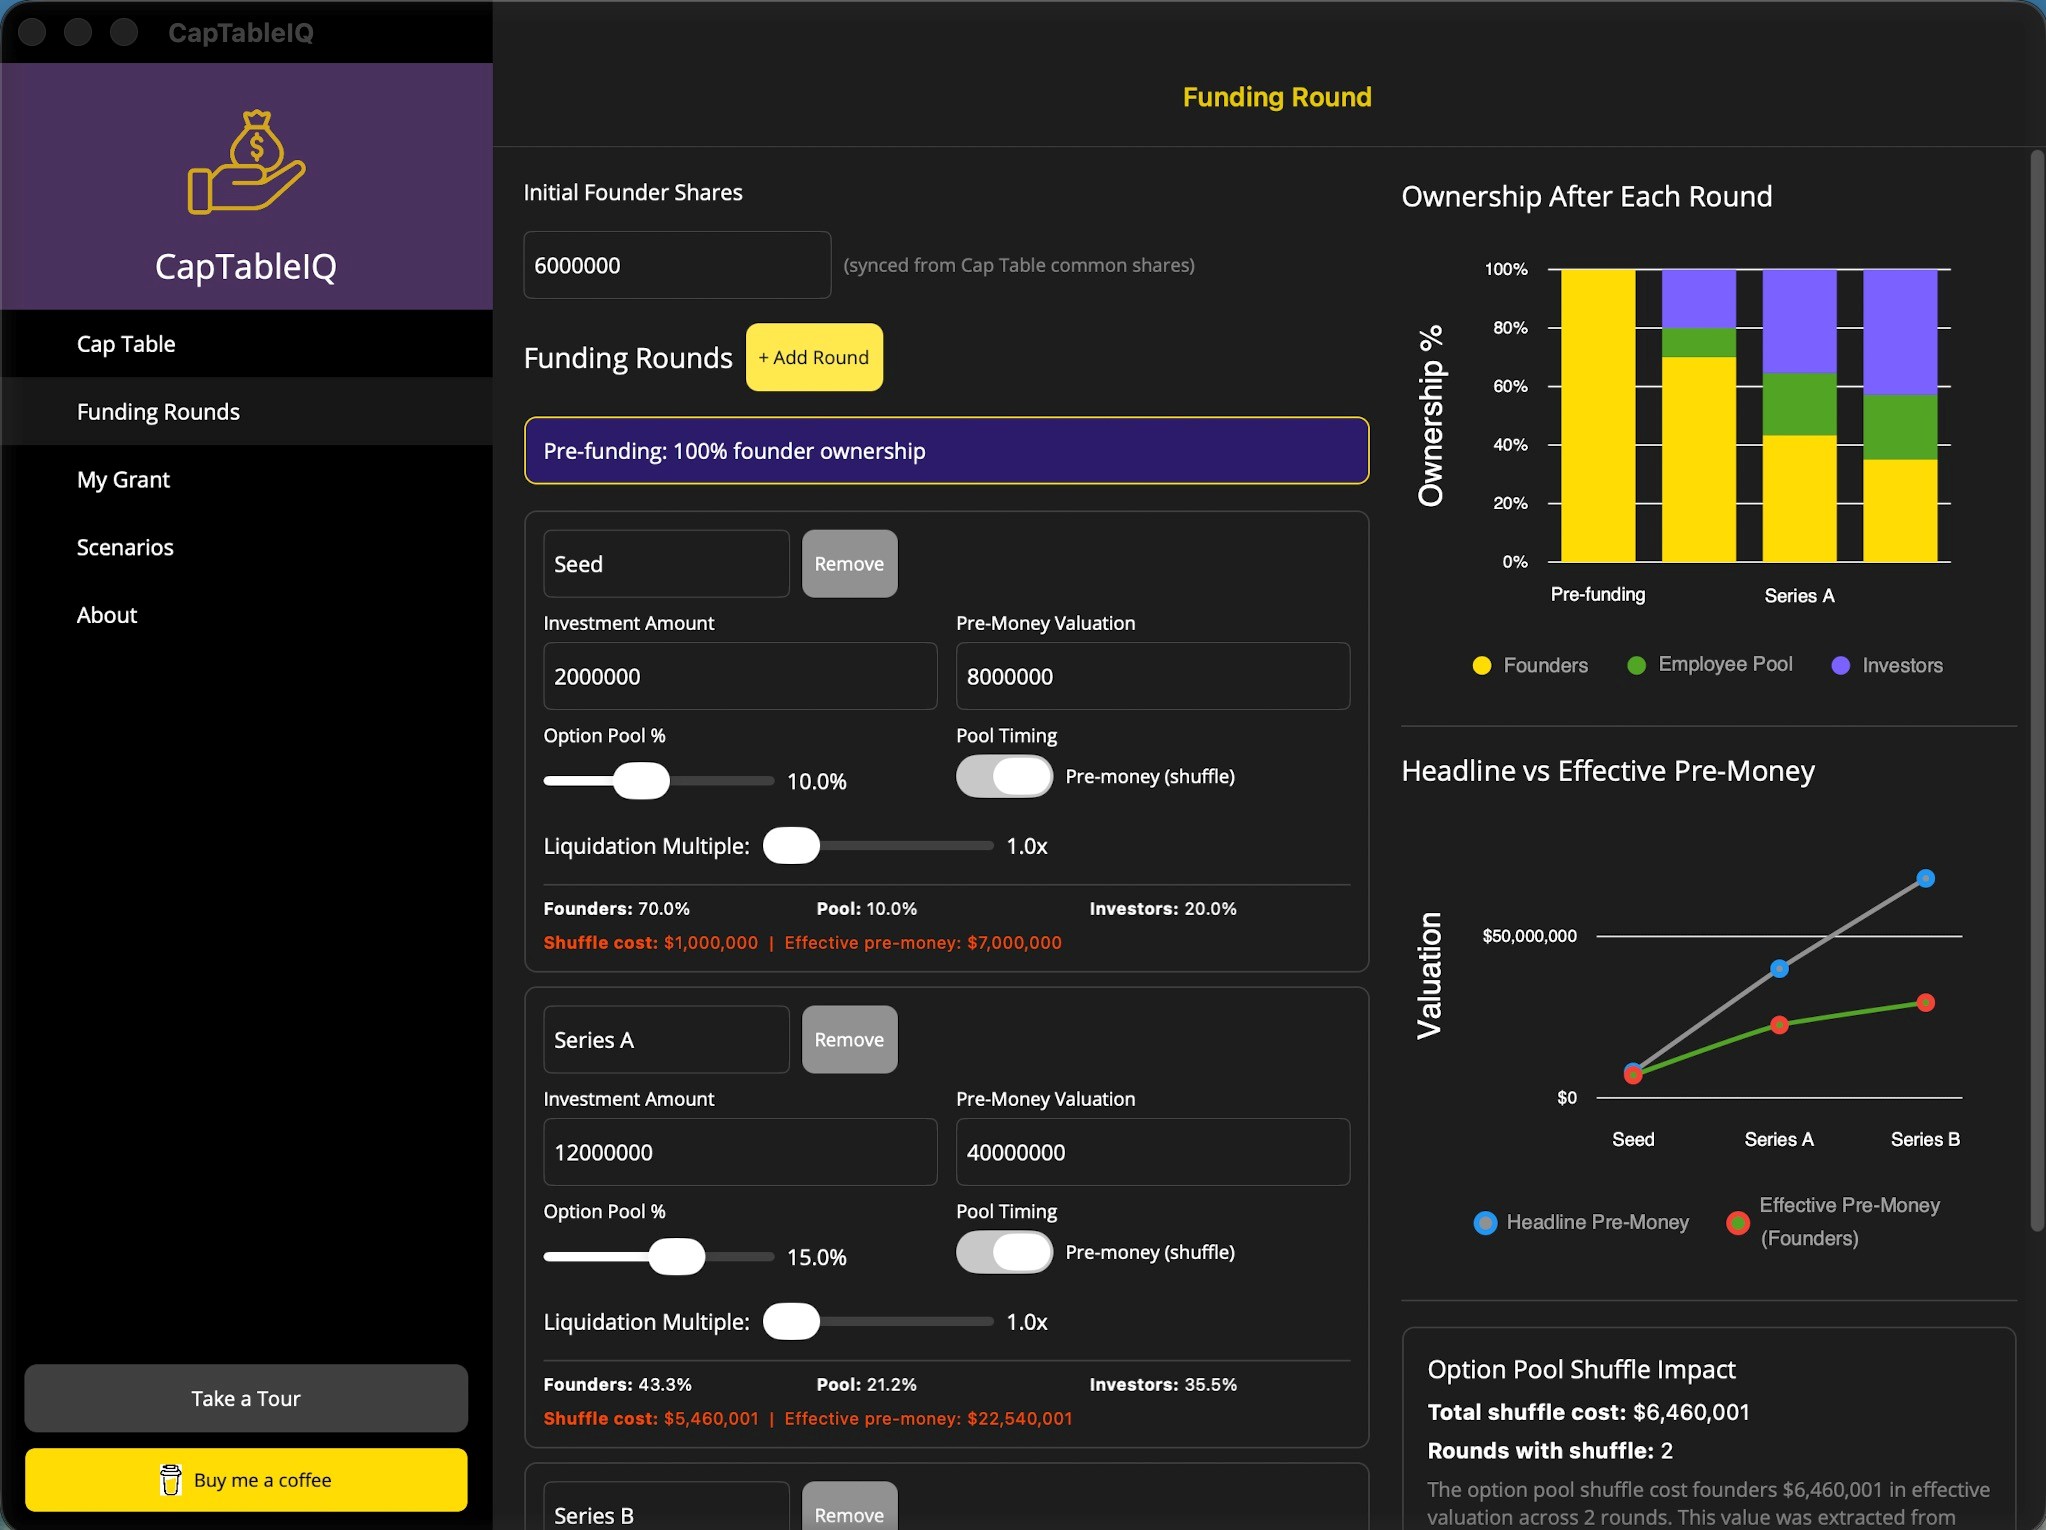
Visualize how your ownership compresses through Seed, Series A, B, and beyond. Spot option pool shuffles and understand the gap between headline and effective valuations.
Capabilities
Features
Model common stock, multiple series of preferred stock with custom seniority, liquidation multiples (1x, 2x+), and participating/non-participating preferences with caps.
Automatically calculates seniority-based distributions, conversion logic, transaction fees, and breakeven thresholds. See who gets paid first, second, and last.
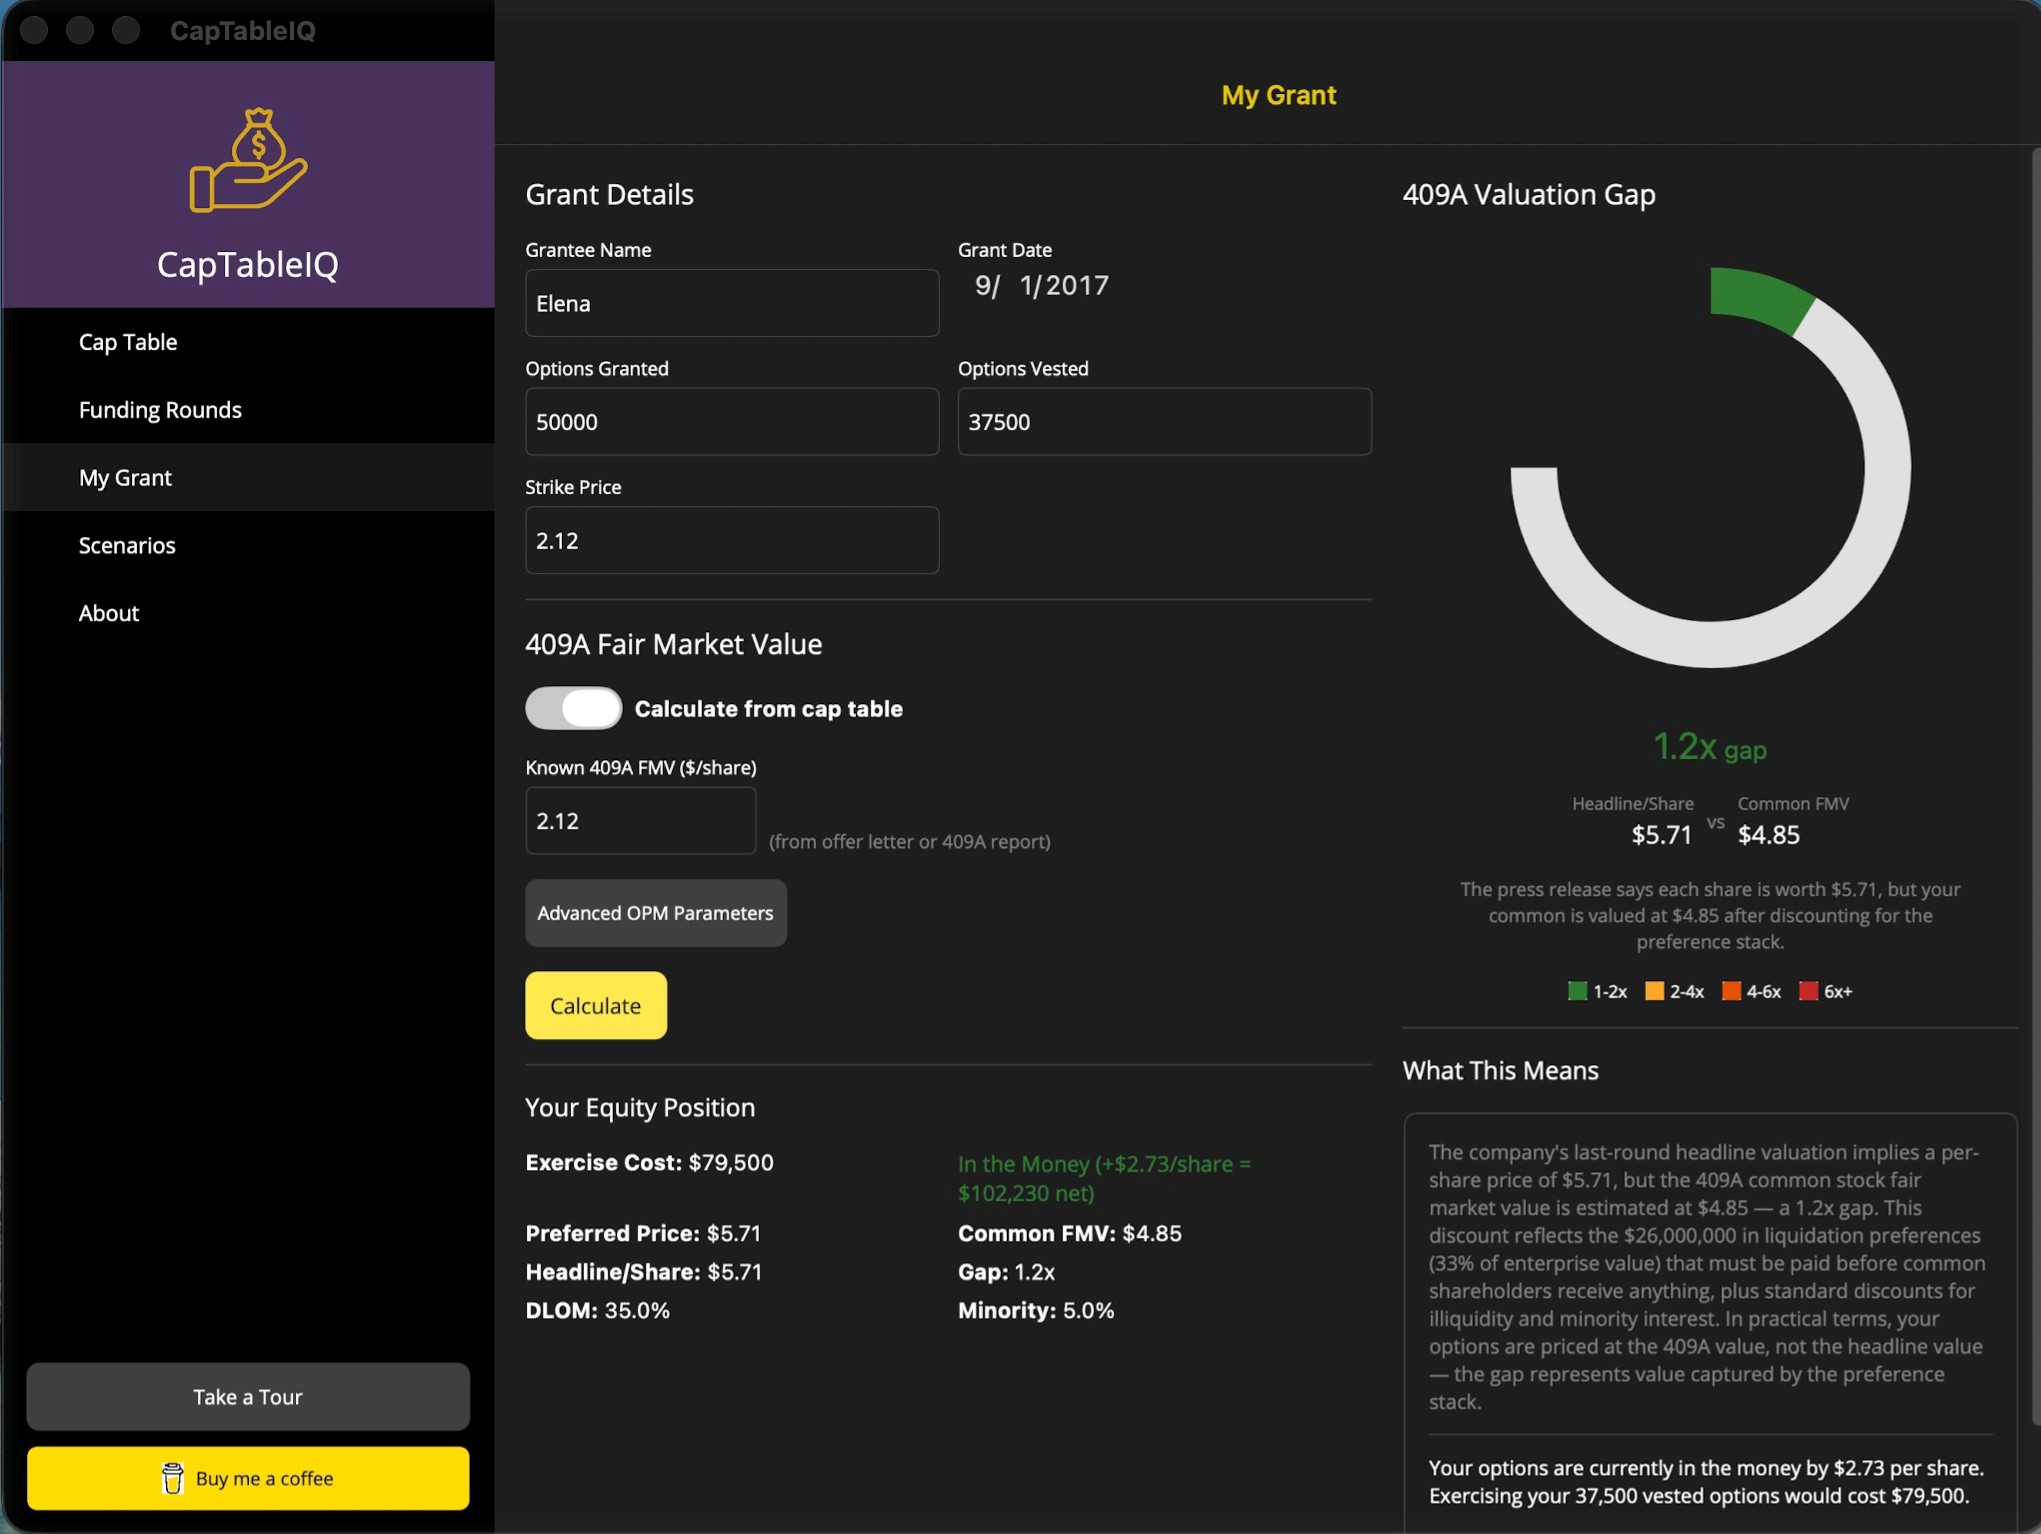
Estimate common stock fair market value using Option Pricing Model (OPM) with Black-Scholes, DLOM discounts, and minority interest adjustments. Know if your options are underwater.
Live pie charts, stacked bar charts, and line graphs update in real-time as you adjust scenarios. Export comprehensive HTML reports with tables and narratives.
Track founder ownership erosion across funding rounds. Quantify the cost of pre-money vs. post-money option pools and see how employee grants impact your stake.
Built with .NET MAUI for native performance on Windows, macOS, iOS, and Android. Your cap table data stays local and private—no cloud required.
Ready to understand your equity?
Blog
Latest Posts
Planning Your Exit: How to Model What You'll Actually Take Home
David H. Friedel Jr. · 2026-03-15
The 409A Mystery Solved: Why Your Options Are Worth Less Than You Think
David H. Friedel Jr. · 2026-03-15
Understanding Your Startup Equity: A First Look at CapTableIQ
David H. Friedel Jr. · 2026-03-15
Gallery